· Rajesh Samalla · Stock Analysis · 4 min read
Stock Analysis - Steel Exchange India Ltd (STEELXIND)
Steel Exchange India Ltd. (SEIL) is approaching a critical resistance level, with bullish momentum building and the potential for a breakout rally ahead.

Introduction to Steel Exchange India Ltd.
Steel Exchange India Ltd. (SEIL) is a prominent player in India’s steel manufacturing sector, contributing significantly to the country’s infrastructural development. SEIL is involved in the production and trading of steel products such as billets, TMT bars, and ingots, which are widely used in construction and manufacturing. The company’s integrated operations—from steel melting to rolling and trading—allow it to maintain a competitive position in the market.
The demand for steel is often cyclical, following trends in infrastructure development, construction activities, and global economic conditions. With increasing infrastructure projects and a growing manufacturing sector in India, companies like SEIL stand to benefit from the long-term demand for steel. However, stock prices for companies in this sector are influenced by various factors such as raw material costs, global steel prices, government policies, and overall market sentiment.
Technical Analysis of Steel Exchange India Ltd. Stock (STEELXIND)
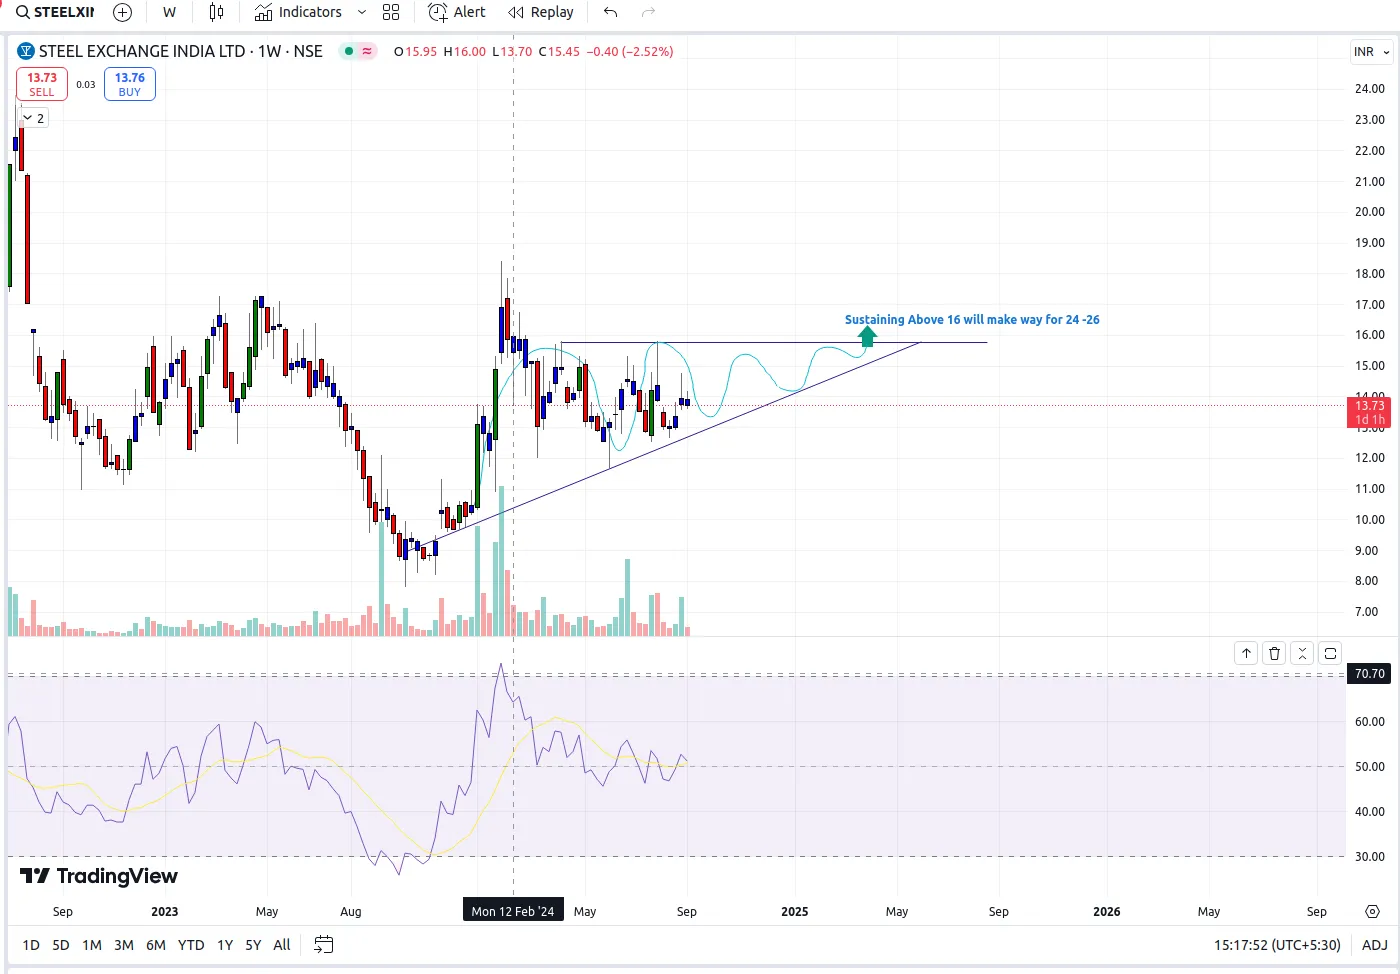
We’ll now delve into the technical analysis of SEIL’s stock based on the weekly chart that suggests the potential for a breakout rally from the current levels to ₹24-₹26.

Current Stock Price & Resistance Level
- Stock Price: At the time of analysis, the stock is trading around ₹13.73.
- Resistance Level: The stock price faces significant resistance around the ₹16 level. This level has historically acted as a barrier, preventing the stock from moving higher. The chart indicates that a sustained move above ₹16 is crucial for the stock to gain upward momentum. This level is important because it has previously acted as a resistance line, which the stock has struggled to break.
Trendline and Support
A ascending trendline is visible with mixture of clear sideways momentum of prices, where the stock has been forming higher lows since mid-2023. This upward trendline acts as a support level, with prices bouncing off it multiple times, indicating a bullish sentiment in the stock. The slightly rising trendline suggests that buyers are consistently stepping in at higher price points, This is a promising indication for future price movements and will set the stage for bullish momentum.
Volume Analysis:
The volume has been steady but flat. If the stock is to break out above ₹16, an increase in volume will be necessary to confirm the upward move. A volume spike would show that investors are buying into the breakout, adding conviction to the move. Historically, breakouts with low volume tend to lack sustainability, so keeping an eye on this metric is important for traders.
Relative Strength Index (RSI):
The RSI is a momentum indicator used to gauge whether a stock is overbought or oversold. In this case, the RSI appears to be in a neutral zone around 50, neither overbought nor oversold, indicating there is room for upward movement without reaching an overheated state. A further uptick in RSI, combined with price movement above ₹16, would signal strength in the stock.
Breakout Possibility: ₹16 as a Critical Level
The chart outlines a possible breakout above ₹16. If the stock closes above this level on a weekly basis with strong volume, it would signal that the resistance has been broken. This could pave the way for a target price of ₹24-₹26, as indicated in the chart’s projection. The stock could experience a rally towards these levels in a wave-like pattern, characterized by minor pullbacks but an overall bullish direction.
The stock price history shows that ₹16 is not just a psychological barrier but also a technical one, with multiple failed attempts to break past it. A confirmed breakout would indicate that investor sentiment has shifted, and the market may be expecting positive developments, whether in terms of business performance or broader industry conditions.
My view shared is completely for study purpose only, Please consult your financial advisor before making any investment decisions.
